Order Profitability & Cost Analysis Model
Built an Excel-based financial model to track true order-level profitability by combinBuilt an Excel-based financial model to calculate true order-level profitability by combining ERP and WMS dataing ERP and WMS data.
Excel | Financial Modeling | NetSuite | Data Analysis
Overview
In my previous role, I developed a daily reporting model to calculate order-level profitability by combining data from NetSuite (ERP) and our warehouse management system.
The objective was to move beyond surface-level revenue reporting and establish a clear, consistent view of true margins by incorporating fulfillment and shipping costs.
Problem
Order profitability wasn’t fully visible because key cost components were split across multiple systems.
Revenue and product costs were available in NetSuite, while shipping and 3PL fees were managed separately in the WMS. Without consolidating these, margin reporting was incomplete and often overstated.
This made it difficult to:
- Accurately evaluate order-level profitability
- Identify cost drivers impacting margin
- Flag orders where fulfillment costs exceeded acceptable thresholds
Data & Model Structure
I built an Excel-based model that consolidated data from multiple sources into a single profitability view.
- NetSuite: order data, revenue, item-level cost
- WMS: shipping costs, fulfillment (3PL) fees
Core Model Components:
- Revenue
- Cost of Goods Sold (COGS)
- Shipping & Fulfillment Costs
- Total Cost per Order
- Gross Profit
- Margin %
How It Works
Each order was matched across systems and normalized into a single dataset. Costs were aggregated at the order level, allowing for a consistent calculation of total cost and profit per order.
Analysis & Logic
The model focused on calculating “true profitability” by ensuring all major cost drivers were consistently captured and applied at the order level.
- Allocating shipping and 3PL costs per order
- Combining multi-line orders into a single profitability view
- Standardizing cost calculations across different data sources
- Creating a consistent formula for profit and margin across all orders
- Identifying and flagging orders where fulfillment costs exceeded predefined thresholds
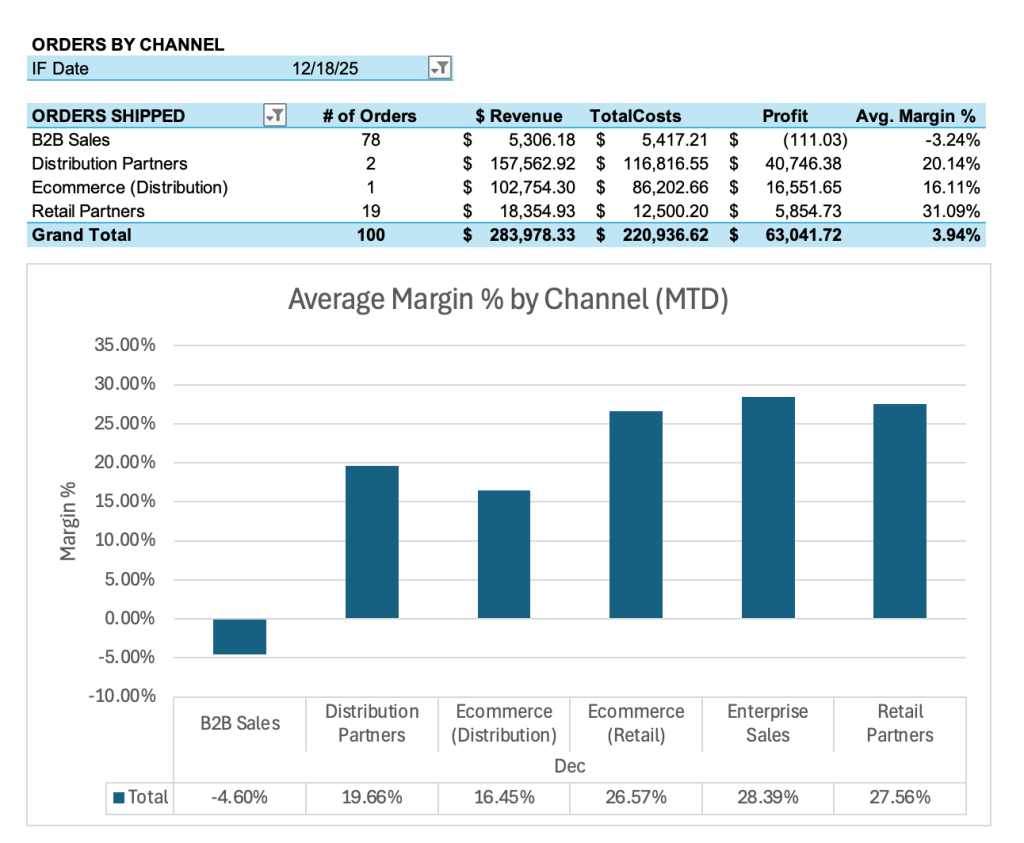
Output & Reporting
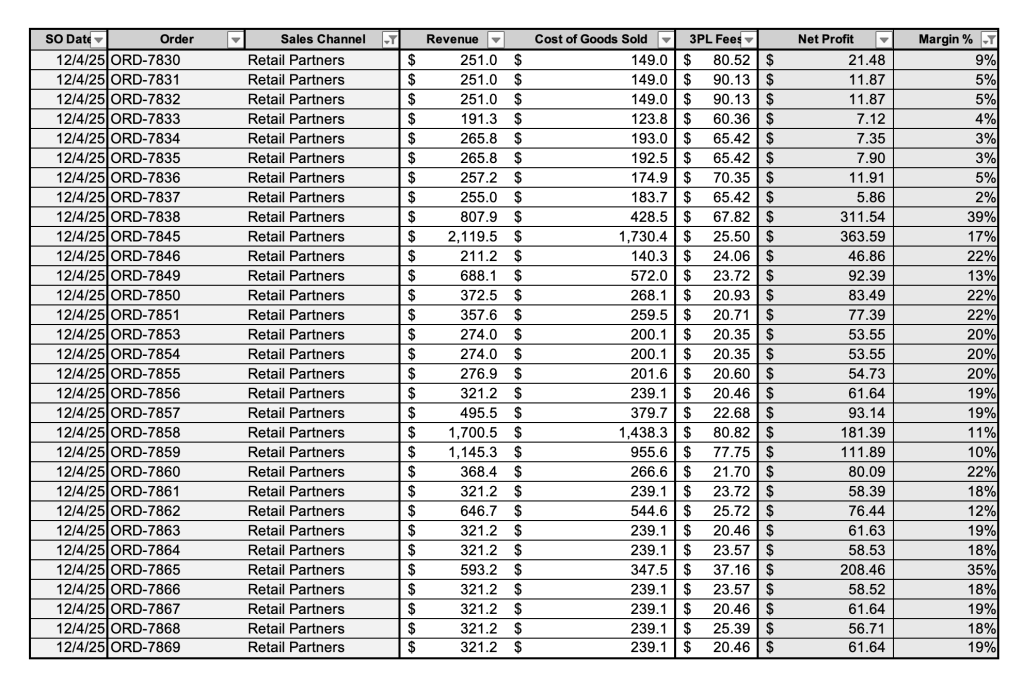
The final output was a daily reporting view used to monitor profitability trends, identify outliers, and flag cost anomalies.
- Total revenue, cost, and profit
- Margin % by day
- Order-level profitability breakdown
- Flags for orders with unusually high fulfillment costs
Key Insights
This analysis helped surface key drivers impacting profitability:
- Shipping and fulfillment costs were the primary drivers of margin variability
- Orders with higher shipping-to-revenue ratios consistently showed reduced profitability
- A subset of orders exceeded acceptable cost thresholds, highlighting opportunities for pricing adjustments and operational improvements
Outcome / Impact
This model provided a more accurate view of order-level profitability and helped identify cost inefficiencies that were not visible in standard reporting.
Next Steps/Enhancements
If expanded further, this model could support:
- Scenario analysis (e.g., impact of increased shipping costs or discounts)
- Profit forecasting based on historical trends
- Automation of reporting through BI tools like Power BI, Tableau, etc
- Integration into a centralized dashboard for real-time visibility
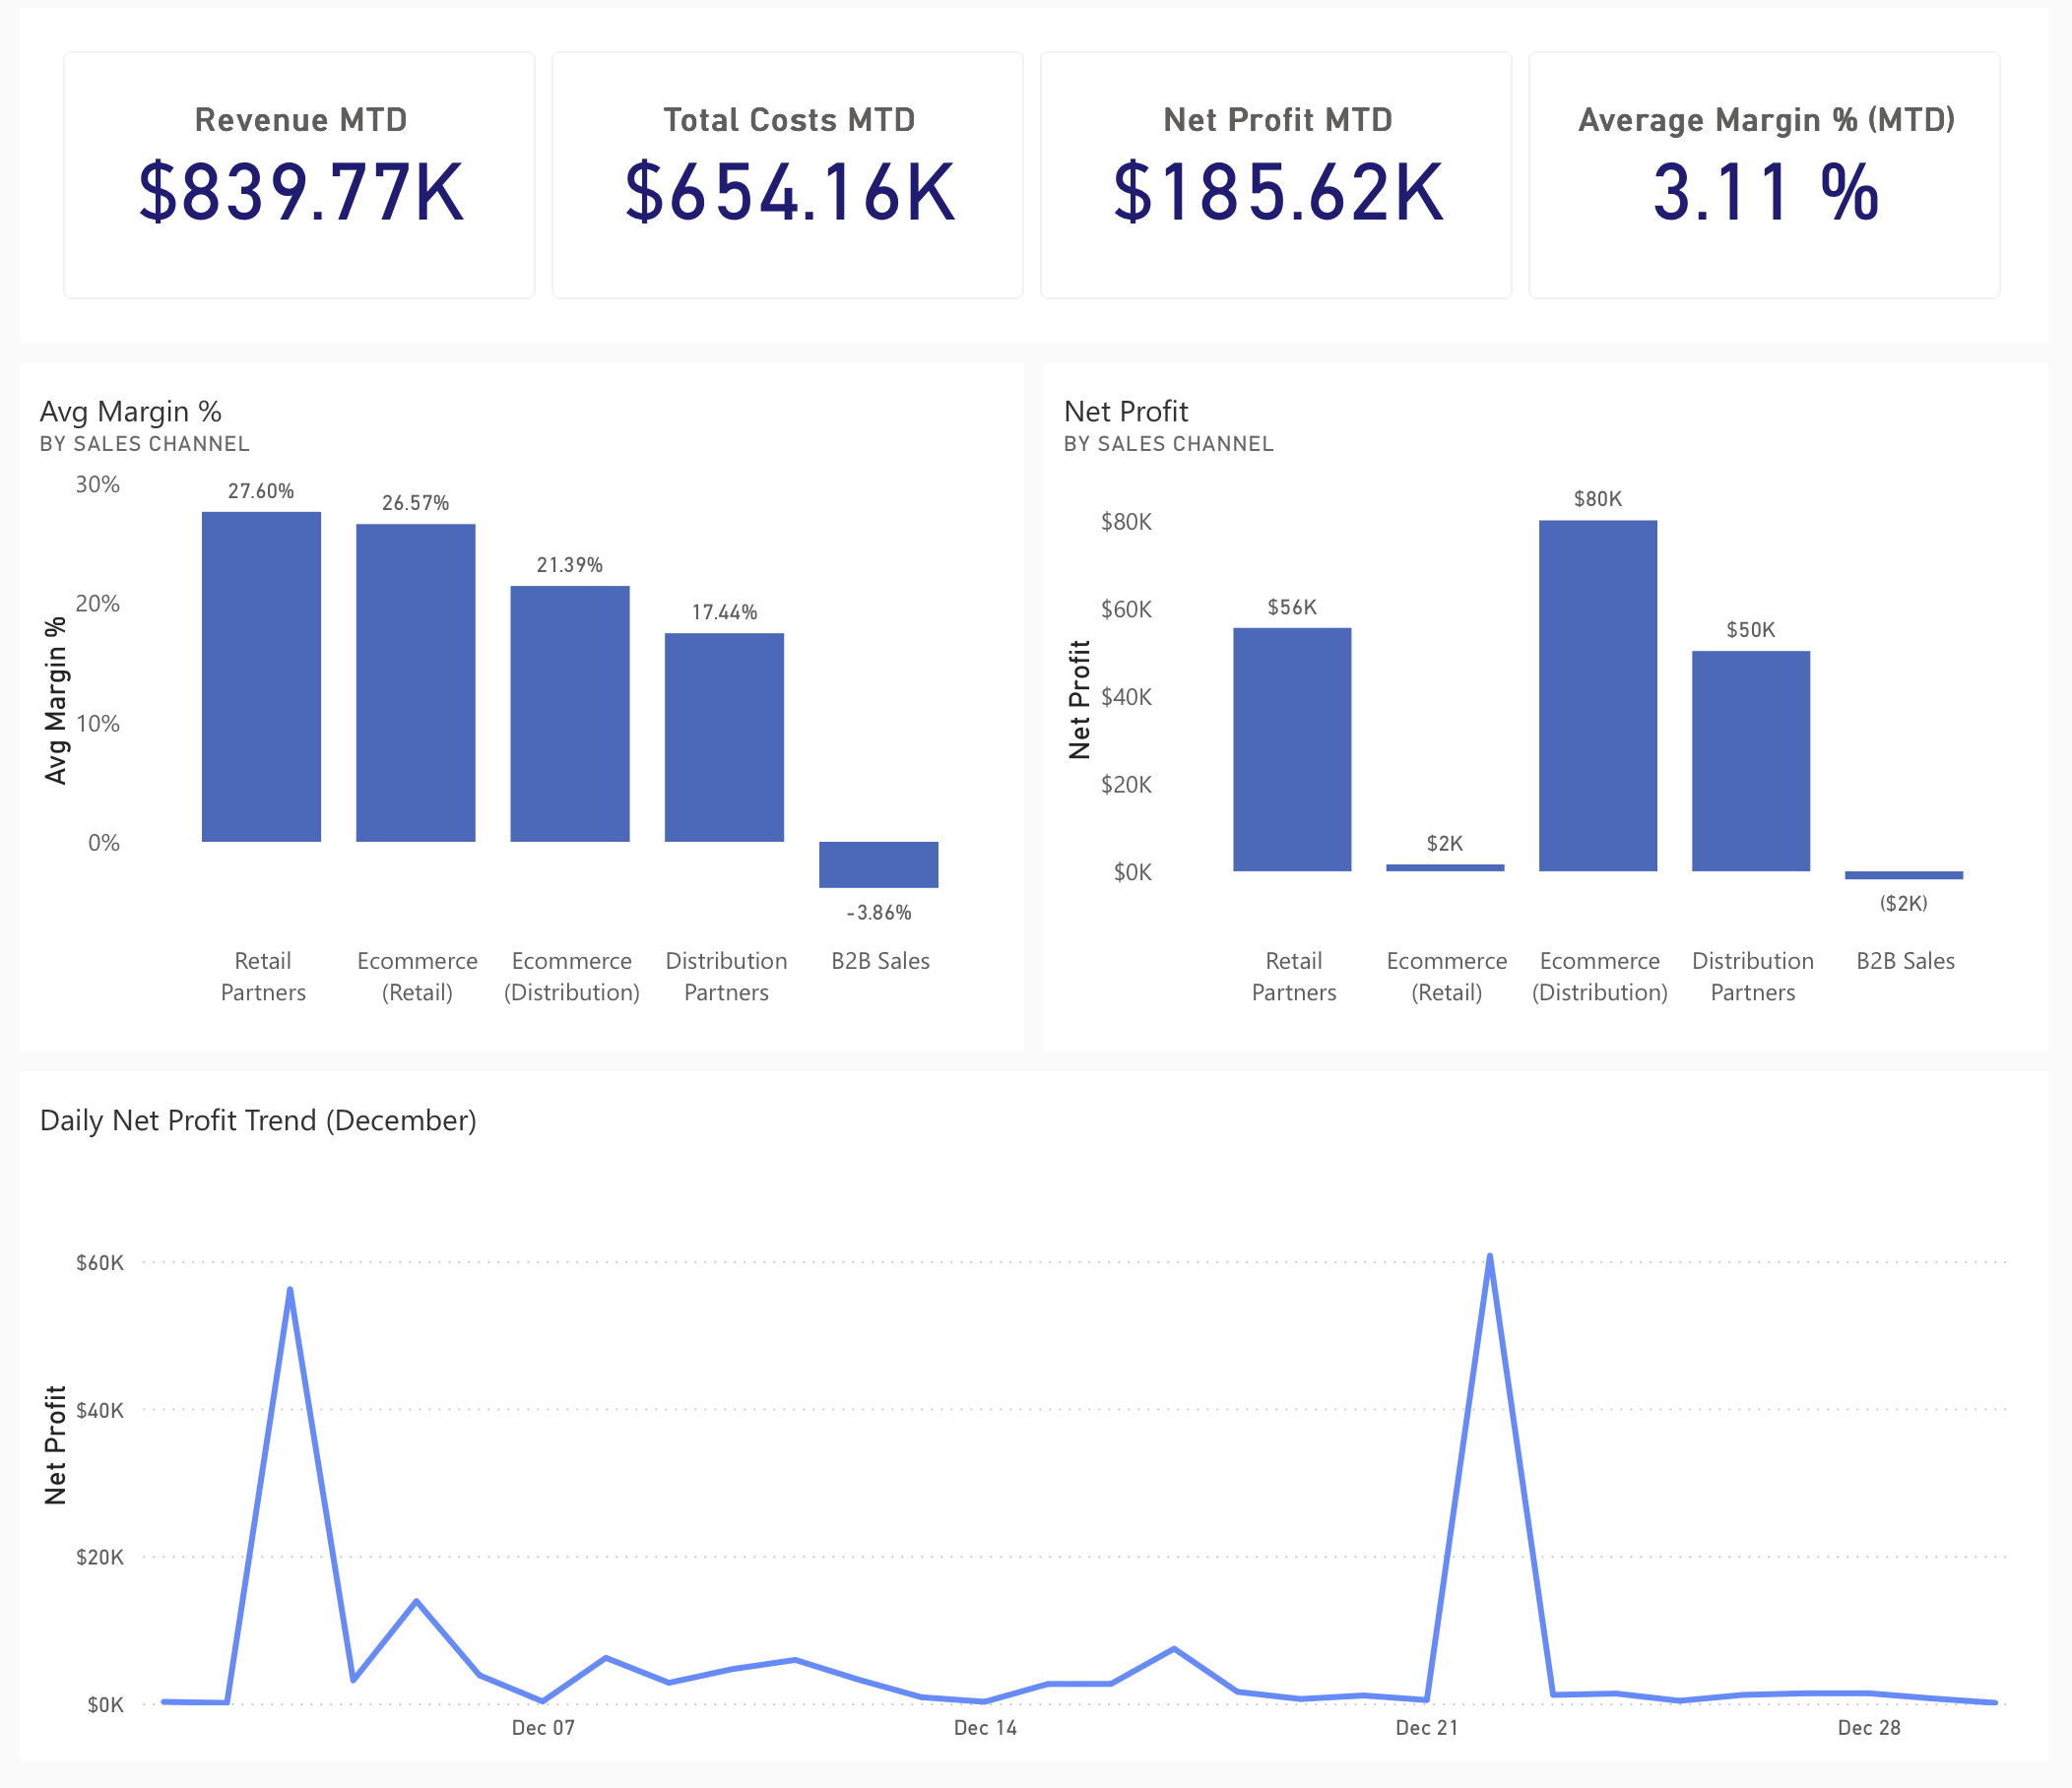
Sample Dashboard Prototype (Power BI)
A simplified Power BI dashboard was created to visualize profitability trends and compare performance across sales channels.